
1. Overview
K-means clustering is a simple and elegant approach for partitioning a data set into K distinct, nonoverlapping clusters. To perform K-means clustering, we must first specify the desired number of clusters K; then, the K-means algorithm will assign each observation to exactly one of the K clusters. The below figure shows the results obtained from performing K-means clustering on a simulated example consisting of 150 observations in two dimensions, using three different values of K.

The K-means clustering procedure results from a simple and intuitive mathematical problem.
2. Introduction
What truly fascinates us about clusterings is how we can group similar items, products, and users. This grouping or segmenting works across industries, and that’s what makes the concept of clustering such an important one in data science.
Clustering helps us understand our data in a unique way – by grouping things into – you guessed it – clusters.
In this article, we will cover k-means clustering and its components comprehensively. We’ll look at clustering, why it matters, its applications and then deep dive into k-means clustering.
3. What is Clustering?
Let’s kick things off with a simple example. A bank wants to give credit card offers to its customers. They currently look at each customer’s details and, based on this information, decide which offer should be given to which customer.
Now, the bank can potentially have millions of customers. Does it make sense to look at the details of each customer separately and then make a decision? Certainly not! It is a manual process and will take a considerable amount of time.
So what can the bank do? One option is to segment its customers into different groups. For instance, the bank can group the customers based on their income:

Can you see where I’m going with this? The bank can now make three different strategies or offers, one for each group. Here, instead of creating different strategies for individual customers, they only have to make three strategies. It will reduce the effort as well as the time.
The groups I have shown above are known as clusters, and the process of creating these groups is known as clustering. So we can say that-
“Clustering is the task of dividing the population or data points into several groups such that data points in the same groups are more similar to other data points in the same group than those in other groups.”
Can you guess which type of learning algorithm clustering is- Supervised, Unsupervised or Semi-supervised?
From the above example, you already interpreted that clustering is an unsupervised learning algorithm.
4. What is K-Means Clustering?
K-Means clustering is an unsupervised learning algorithm. There is no labelled data for this clustering, unlike in supervised learning. K-Means performs the division of objects into clusters that share similarities and are dissimilar to the objects belonging to another cluster.
The term ‘K’ is a number. You need to tell the system how many clusters you need to create. For example, K = 2 refers to two clusters. There is a way of finding out the best or optimum value of K for a given data.
Understanding the Algorithm
The K-means clustering procedure results from a simple and intuitive mathematical problem. We begin by defining some notation. Let C1, . . ., CK denotes sets containing the indices of the observations in each cluster. These sets satisfy two properties:
1. C1 ∪ C2 ∪ . . . ∪ CK = {1, . . ., n}. In other words, each observation belongs to at least one of the K clusters.
2. Ck ∩ Ck′ = ∅ for all k != k′. In other words, the clusters are nonoverlapping: no observation belongs to more than one cluster.
For instance, if the ith observation is in the kth cluster, then i ∈ Ck. The idea behind K-means clustering is that a good clustering is one for which the within-cluster variation is as small as possible. The within-cluster variation for cluster Ck is a measure W(Ck) of the amount by which the observations within a cluster differ from each other. Hence we want to solve the problem
In other words, this formula says that we want to partition the observations into K clusters such that the total within-cluster variation, summed over all K clusters, is as small as possible. Solving the above equation seems like a reasonable idea, but we need to define the within-cluster variation to make it actionable. There are many possible ways to define this concept, but by far, the most common choice involves squared Euclidean distance. That is, we define
Where |Ck| denotes the number of observations in the kth cluster. In other words, the within-cluster variation for the kth cluster is the sum of all of the pairwise squared Euclidean distances between the observations in the kth cluster, divided by the total number of observations in the kth cluster. Combining both of the above equations gives the optimization problem that defines K-means clustering,

Now, we would like to find an algorithm to solve the above Algorithm — that is, a method to partition the observations into K clusters such that the objective of the last equation is minimized. This is a very difficult problem to solve precisely since there are almost Kn ways to partition n observations into K clusters. This is a huge number unless K and n are tiny! Fortunately, a very simple algorithm can be shown to provide a local optimum—a pretty good solution—to the K-means optimization problem. This approach is laid out in the following Algorithm.
Algorithm:
- Randomly assign a number, from 1 to K, to each of the observations.
- These serve as initial cluster assignments for the observations.
- Iterate until the cluster assignments stop changing:
- For each of the K clusters, compute the cluster centroid. The kth cluster centroid is the vector of the p feature means for the observations in the kth cluster.
- Assign each observation to the cluster whose centroid is closest (where closest is defined using Euclidean distance).
5. How to find the optimal value of K?
K is a hyperparameter to the K-means Algorithm. In most cases, the number of clusters K is determined in a heuristic fashion. Most strategies involve running K-means with different K–me values and finding the best value using some criterion. The two most popular criteria used are the elbow and the silhouette methods.
Elbow Method
The elbow method involves finding a metric to evaluate how good a clustering outcome is for various values of K and finding the elbow point. Initially, the quality of clustering improves rapidly when changing the value of K but eventually stabilizes. The elbow point is the point where the relative improvement is not very high anymore. This is shown pictorially in the two graphs below for the metric average within-cluster sum of squares.

Two famous metrics used are the average within-cluster sum of squares and the percentage of variance explained. These metrics are elaborated on in the pictures below.
The average within-cluster sum of squares measures how cohesive the clusters are.

However, the percentage of variance measures how cohesive the clusters are, however, normalizing with the total variance in the dataset in the denominator.


The picture below shows the elbow curve and the elbow point for the % of variance explained metrics.

Silhouette Method
One of the fundamental steps of an unsupervised learning algorithm is to determine the number of clusters into which the data may be divided. The silhouette algorithm is one of the many algorithms to determine the optimal number of clusters for an unsupervised learning technique.
We assume that the data has already been clustered into k clusters in the Silhouette algorithm by a clustering technique. Then for each data point, we define the following:-
C(i) – The cluster assigned to the ith data point
|C(i)| – The number of data points in the cluster assigned to the ith data point
a(i) – It gives a measure of how well assigned the ith data point is to its cluster
b(i) – It is defined as the average dissimilarity to the closest cluster, which is not its cluster
The silhouette coefficient s(i) is given by:-
We determine the average silhouette for each value of k. For the value of k, which has the maximum value of s(i), it is considered the optimal number of clusters for the unsupervised learning algorithm.
Let us consider the following data:-
| S. No | X1 | X2 |
| 1. | -7.36 | 6.37 |
| 2. | 3.08 | -6.78 |
| 3. | 5.03 | -8.31 |
| 4. | -1.93 | -0.92 |
| 5. | -8.86 | 6.60 |
We now iterate the values of k from 2 to 5. We assume that no practical data exists for which all the data points can be optimally clustered into 1 cluster.
We construct the following tables for each value of k:-
| S. No. | a(i) | b(i) | s(i) |
| 1. | 5.31 | 14.1 | 0.62 |
| 2. | 2.47 | 13.15 | 0.81 |
| 3. | 2.47 | 14.97 | 0.84 |
| 4. | 9.66 | 8.93 | -0.076 |
| 5. | 5.88 | 19.16 | 0.69 |
Average value of s(i) = 0.58
k = 3
| S. No | a(i) | b(i) | s(i) |
| 1. | 1.52 | 9.09 | 0.83 |
| 2. | 2.47 | 7.71 | 0.68 |
| 3. | 2.47 | 10.15 | 0.76 |
| 4. | 0 | 7.71 | 1 |
| 5. | 1.52 | 17.93 | 0.92 |
Average value of s(i) = 0.84
k = 4
| S. No | a(i) | b(i) | s(i) |
| 1. | 1.52 | 9.09 | 0.83 |
| 2. | infinite | 2.47 | 0 |
| 3. | infinite | 2.47 | 0 |
| 4. | infinite | 7.71 | 0 |
| 5. | 1.52 | 10.23 | 0.85 |
Average value of s(i) = 0.37
k = 5
| S. No | a(i) | b(i) | s(i) |
| 1. | infinite | 1.52 | 0 |
| 2. | infinite | 2.47 | 0 |
| 3. | infinite | 2.47 | 0 |
| 4. | infinite | 7.71 | 0 |
| 5. | infinite | 1.52 | 0 |
Average value of s(i) = 0
We see that the highest value of s(i) exists for k = 3. Therefore we conclude that the optimal number of clusters for the given data is 3.
6. Working of the Algorithm
The flowchart below shows how k-means clustering works:
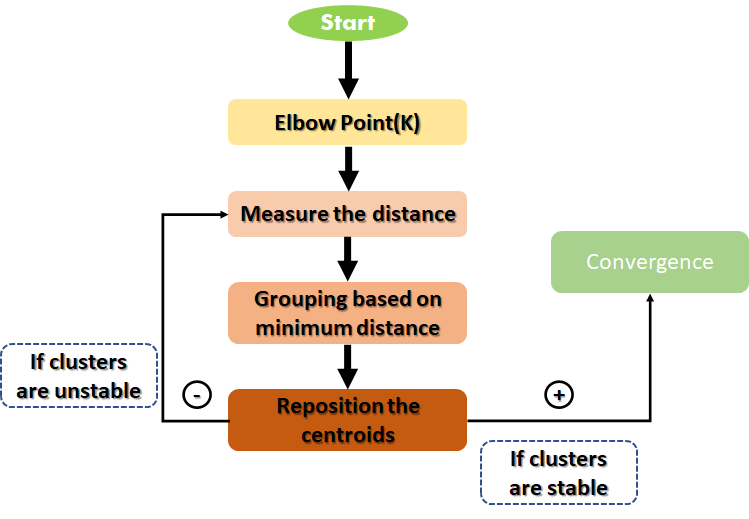
The goal of the K-Means algorithm is to find clusters in the given input data. There are a couple of ways to accomplish this. We can use the trial and error method by specifying the value of K (e.g., 3,4, 5). As we progress, we keep changing the value until we get the best clusters.
Let’s now take an example to understand how K-Means works:

We have these 8 points, and we want to apply k-means to create clusters for these points. Here’s how we can do it.
Step 1: Choose the number of clusters K
The first step in k-means is to pick the number of clusters, k.
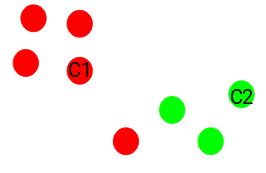
Step 2: Select K random points from the data as centroids
Next, we randomly select the centroid for each cluster. Let’s say we want to have 2 clusters, so k is equal to 2 here. We then randomly select the centroid:

Here, the red and green circles represent the centroid for these clusters.
Step 3: Assign all the points to the closest cluster centroid
Once we have initialized the centroids, we assign each point to the nearest cluster centroid:
Here, you can see that the points closer to the red point are assigned to the red cluster, whereas the points closer to the green point are assigned to the green cluster.
Step 4: Recompute the centroids of newly formed clusters
Now, once we have assigned all of the points to either cluster, the next step is to compute the centroids of newly formed clusters:

Here, the red and green crosses are the new centroids.
Step 5: Repeat steps 3 and 4
We then repeat steps 3 and 4:

In this example, after 5 iterations, the calculated centroids remain the same, and data points are not switching clusters anymore (the Algorithm converges). Here, each centroid is shown as a dark coloured data point.

7. Advantages and Disadvantages
- Advantages of Algorithm:
- It is a step-wise representation of a solution to a given problem, which makes it easy to understand.
- An algorithm uses a definite procedure.
- It is not dependent on any programming language, so it is easy to understand for anyone, even without programming knowledge.
- Every step in an algorithm has its logical sequence, so it is easy to debug.
- By using the Algorithm, the problem is broken down into smaller pieces or steps; hence, it is easier for programmers to convert it into an actual program.
- Disadvantages of Algorithm:
- The Algorithm is Time-consuming.
- Difficult to show Branching and Looping in Algorithms.
- Big tasks are difficult to put in Algorithms.
8. Practical Applications of K-Means
K-means can typically be applied to data with a smaller number of dimensions, numeric, and continuous. Think of a scenario in which you want to make groups of similar things from a randomly distributed collection of things; K-means is very suitable for such scenarios.
Here is a list of some interesting use cases for K-means.
1. Delivery store optimization
Optimize the process of good delivery using truck drones by using a combination of K-means to find the optimal number of launch locations and a genetic algorithm to solve the truck route as a travelling salesman problem.
2. Identifying Crime Localities
With data related to crimes available in specific localities in a city, the category of crime, the area of the crime, and the association between the two can give quality insight into crime-prone areas within a city or a locality.
3. Cyber-profiling Criminals
Cyber-profiling is the process of collecting data from individuals and groups to identify significant correlations. Cyber profiling is derived from criminal profiles, which provide information on the investigation division to classify criminals at the crime scene.
4. Fantasy League Stat Analysis
analyzing player stats has always been a critical element of the sporting world, and with increasing competition, machine learning has a critical role to play here. As an interesting exercise, if you would like to create a fantasy draft team and like to identify similar players based on player stats, k-means can be a useful option.


