
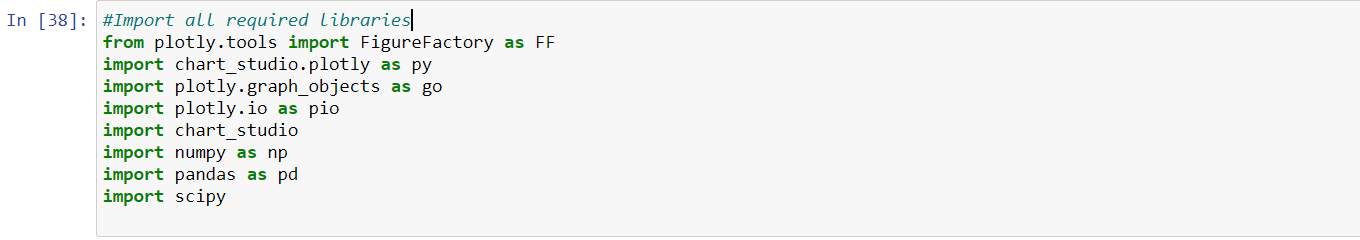
Introduction
In this article, we’ll understand what’s is Hypothesis Testing ,and then we’ll take deep dive into famous T-Test, and its different types.
“You can’t prove a hypothesis; you can only improve or disprove it.” – Christopher Monckton.
 Almost every day we test our new ideas let it be , finding shortest route to any destination , fastest way to finish our work with new idea or finding a better way to do something. But questions is whether our new idea is significantly better than what we tried previously.
And these new ideas or approaches are based on Hypothesis that new approach would be better than the previous one. And testing these approaches to figure out which one works and which one is best left behind, is called Hypothesis testing.
One of the most popular ways to test a hypothesis in statistics, is a concept called the T-test. There are different types of t-tests, as we’ll soon see, and each one has its own unique application. If you’re an aspiring data scientist, you should be aware of what a t-test is and when you can leverage it.
So in this article, we will learn about the various nuances of a t-test and then look at the three different t-test types. The icing on the cake? We will implement each type of t-test in Python to visualize how they work in practical scenarios & randomly generated data. Let’s get going!
What is T- test:-
A t-test compares means of two groups and determines if they’re different from each other. The t test also tells you how significant the differences are; In other words it lets you know if those differences could have happened by chance.
Let’s say a drug company may want to check the efficacy of a newly launched medicine for some disease. And in turn this new medicine has been tested on few volunteers and results of the test tell us that new medicine was effective than previously used medicine. It would seem that the drug might work. But it could be due to a fluke. To test this, researchers would use a T-test to find out if the results are repeatable for an entire population or not.
Common assumptions of T- Test:-
There are certain assumptions we need to heed before performing a t-test:
- The data should follow a continuous or ordinal scale (the IQ test scores of students, for example)
- The samples are independently and randomly drawn
- The distribution of the residuals between the two groups should follow the normal distribution.
- Variances among the groups should be equal (for independent two-sample t-test)
- Sufficient data size (although t-test is essential for small samples)
Types of T-tests?
There are three main types of t-test:
- One sample T-test :- It tests the mean of a single group against a known mean.
For example, do females score higher than the average of 70 on a test if their exam time is switched to 8 a.m.?
- Independent Samples T-test:- It compares the means for two groups(most common form of the T test).
For example, you could run a t test to see if the average test scores of males and females are different; the test answers the question, “Could these differences have occurred by random chance?” The two other types of t test are:
- Paired sample T-test :- It compares means from the same group at different times (say, one year apart).
For example, do test scores differ significantly if the test is taken at 8 a.m. or noon?
Common terminologies in T-Test:-
- t-score
- P-value
- Null Hypothesis & Alternate Hypothesis
What is T-score:-
The t score is a ratio between the difference between two groups and the difference within the groups. The larger the t score, the more the difference between groups. The smaller the t score, the more the similarity between groups. A t score of 4 means that the groups are four times as different from each other as they are within each other. When you run a t test, the bigger the t-value, the more likely it is that the results are repeatable.
- A large t-score tells you that the groups are different.
- A small t-score tells you that the groups are similar
What is p-value-
A p-value is the probability that the results from your sample data occurred by chance. P-values are from 0% to 100%. For example, a p value of 5% is 0.05. Low p-values are good; It indicates that your data did not occur by chance. For example, a p-value of .02 means there is only a 2% probability that the results from an experiment happened by chance. In most cases, a p-value of 0.05 (5%) is accepted to consider the data is valid.
Null Hypothesis & Alternate Hypothesis-
Null Hypothesis (H0)– A statement about a population parameter.
We test the likelihood of this statement being true in order to decide whether to accept or reject out Alternate Hypothesis.It can include =,≤ or ≥ sign.
Alternate Hypothesis(H1)– A statement that directly contradicts the Null Hypothesis.
We determine whether or not to accept or reject this statement based on the likelihood of the Null Hypothesis being true. It can include a ≠,> or < sign.
Additional Info:- Type 1 type 2 Hypothesis error
In statistical hypothesis testing, a type I error is the incorrect rejection of a true null hypothesis (a “false positive”), while a type II error is incorrectly retaining a false null hypothesis (a “false negative”).
One Sample T-Test:-
A One Sample T-Test is a statistical test used to evaluate the null hypothesis that the mean m of a sample dataset of independent observations is equal to the true mean μ of the population from which the data is sampled. In other words, our null hypothesis is that
m = μ
Formula for this test is below-
- t = t-statistic
- m = mean of the group
- µ = theoretical value or population mean
- s = standard deviation of the group
- n = group size or sample size
Independent or Two Sample T-Test:-
If we have two independently sampled datasets (with equal variance) and we’re interested in finding whether the true means μ1 and μ2 are identical, that is, if the data were sampled from the same population, we would perform a Two Sample T-Test.
Typically when a researcher in a field is interested in the affect of a given test variable between two populations, they will take one sample from each population and will note them as the experimental group and the control group. The experimental group is the sample which will receive the variable being tested, while the control group will not.
Let’s say If one pharma company wants to check efficacy of newly launched drug on patients then two sided t-test can be used to investigate if the two groups of patients were sampled from populations with the same true mean, i.e. “whether the new drug have an effect?”
\displaystyle t=\frac{{{{m}_{A}}-{{m}_{B}}}}{{\sqrt{{\frac{{{{S}^{2}}}}{{{{n}_{A}}}}+\frac{{{{S}^{2}}}}{{{{n}_{B}}}}}}}}where,
- mA and mB are the means of two different samples
- nA and nB are the sample sizes
- \displaystyle {{S}^{2}} is an estimator of the common variance of two samples, such as:
Here df (degree of freedom) is nA + nB – 2.
Paired sample T-test:-
The paired sample t-test, sometimes called the dependent sample t-test, is a statistical procedure used to determine whether the mean difference between two sets of observations is zero. In a paired sample t-test, each subject or entity is measured twice, resulting in pairs of observations. Common applications of the paired sample t-test include case-control studies or repeated-measures designs. Suppose you are interested in evaluating the effectiveness of a company training program. One approach you might consider would be to measure the performance of a sample of employees before and after completing the program, and analyse the differences using a paired sample t-test.
\displaystyle t=\frac{m}{{{}^{s}\!\!\diagup\!\!{}_{{\sqrt{n}}}\;}}where,
- t = t-statistic
- m = mean of the group
- µ = theoretical value or population mean
- s = standard deviation of the group
- n = group size or sample size
We can take the degree of freedom in this test as n – 1 since only one group is involved.
Now let’s deep dive and implement each variant of T-test in Python.
1. Implementation of One Sample T-Test :-
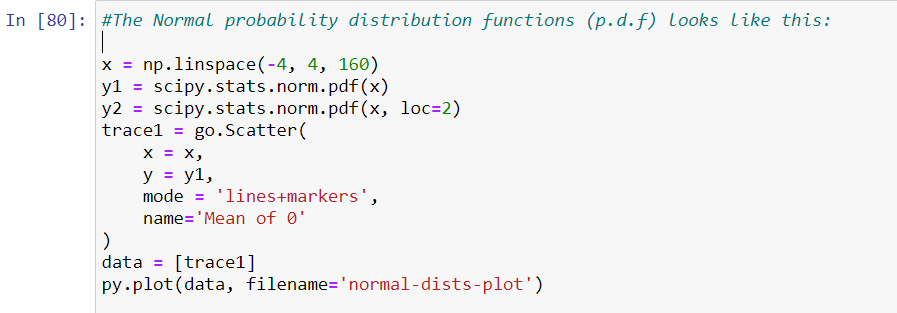
To demonstrate the idea of One Sample T-test , we’ll generate sample 50 data points from a normal distribution with mean μ=0 and variance σ2=1 . So we can skip assumption checks like Normal Distribution , Outliers & variance checks.

Implement One Sample T-test:-
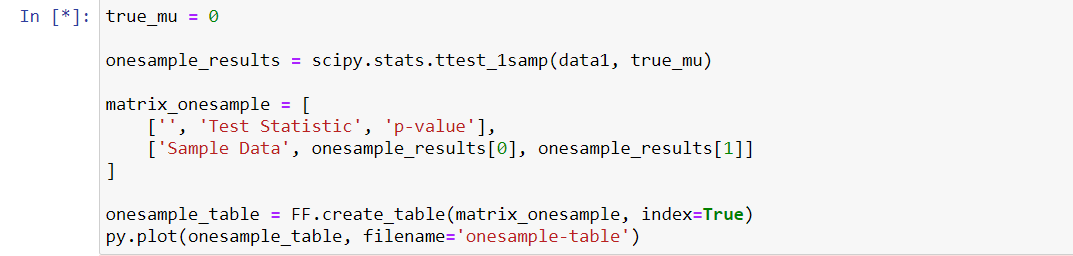

 Interpretation of Results:-
Since our p-value is greater than our Test-Statistic, we have good evidence to not reject the null-hypothesis at the 0.05 significance level. This is our expected result because the data was collected from a normal distribution.
2. Independent or Two Sample T-Test
So for this variant of test we’ll generate one more sample of data with mean μ=2 and variance σ2=1. , So we can check whether mean of these two samples are same or not.

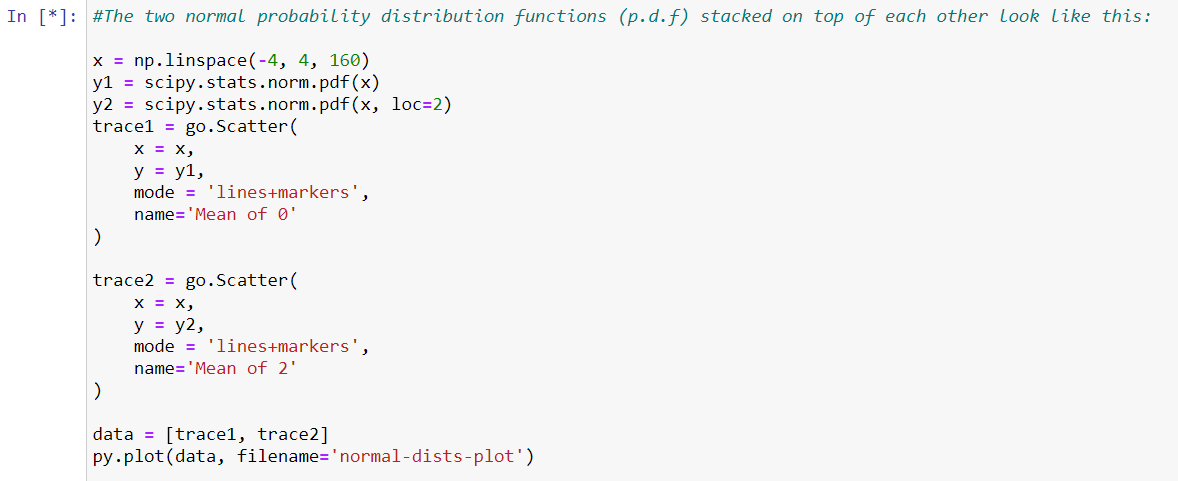
Implement Independent or Two Sample T-test:-


 Interpretation of Results:-
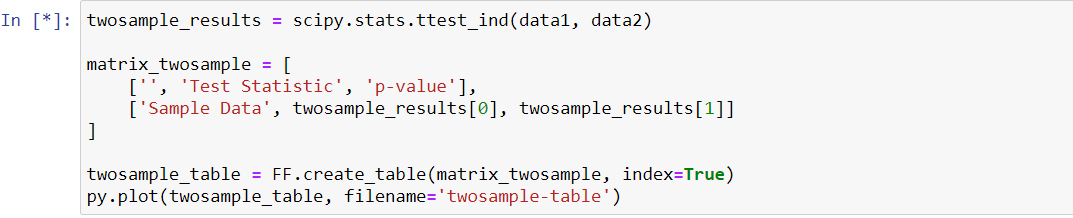

Since our p-value is much less than our Test Statistic, then with great evidence we can reject our null hypothesis of identical means. This is in alignment with our setup, since we sampled from two different normal pdfs with different means.
3. Paired sample t-test
So for this we’ll use the same two samples and will determine whether the mean difference between two sets of observations is zero.


 Interpretation of Results:-
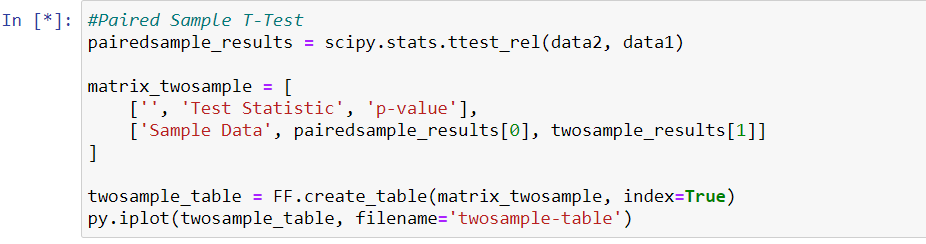

Since our p-value is much less than our Test Statistic, then with great evidence we can reject our null hypothesis of identical means.
Note:-
Python stats.ttest_1samp is for two-tailed test. Make sure to half the p-value and check the sign of t-statistic for one-tailed test.
End Notes:-
I’ve tried to cover basics of t-Test in this article. Stay tuned to next part of this series , where we’ll implement t-test on close to real time data. Meanwhile , you can check out other few important tests in statistics below-
- https://towardsmachinelearning.org/chi-square-test-covid-19/
- https://towardsmachinelearning.org/anova-test-covid-19-india/
- https://towardsmachinelearning.org/z-test/
Article Credit:-
Name: Praveen Kumar Anwla
Founder: TowardsMachineLearning.Org Linkedin


