
Introduction-
It does take great maturity to understand that the opinion we are arguing for is merely the hypothesis we favor, necessarily imperfect, probably transitory, which only very limited minds can declare to be a certainty or a truth
Milan Kundera, Encounter
What Is a Z-Test?
Z-test is a statistical test used to determine whether two population means are different when the variances are known .
Z-tests are closely related to t-tests, but t-tests are best performed when an experiment has a small sample size & standard Deviation is known.
Assumptions of Z-Test:-
Like every other Hypothesis test , there’re few assumptions that need to be held true before one employ Z – Test-
- Your sample size is greater than 30. Otherwise, use a t test.
- Data points should be independent from each other.
- Your data should be normally & randomly distributed. However, for large sample sizes (over 30) this doesn’t always matter.
- Sample sizes should be equal if at all possible.
The t and z tests are known as parametric because the assumption is made that the samples are normally distributed.
Steps in Z- Test:-
A Z- Test can be performed in following steps-
- State the null hypothesis (H0) and alternate hypothesis (H1).
- Choose an alpha level or significance value..
- Calculate the z test statistic (discussed in article below).
- Find the critical value of z in a z table.
- Compare the test statistic to the critical z value and decide if you should support or reject the null hypothesis.
Types of Z-Test:-
1.One Sample Z-test-
It’s used to check whether a sample parameter (such as the mean) is significantly different than a population parameter or from some hypothesized value.
This is also called hypothesis of inequality.
- Null hypothesis (H0) : population proportion is equal to hypothesized proportion
- Alternative hypothesis(H1):
- population proportion is not equal to hypothesized proportion (two -tailed)
- Population proportion is greater than hypothesized proportion (one -tailed)
- Population proportion is less than hypothesized proportion (one -tailed)
Formula for Z- test can we written like below-
\displaystyle Z-Statistic=\frac{{\overline{x}-\mu }}{{{}^{\sigma }\!\!\diagup\!\!{}_{{\sqrt{n}}}\;}}
Where –
\displaystyle \overline{x} – mean of the sample
\displaystyle \overline{x} -mean of the population
\displaystyle \sigma – Standard Deviation of population
n- number of observations
Z-Statistic , or Z-score is a number representing how many standard deviations above or below the mean population a scored derived from.
Let us understand one sample Z- test using an example-
Question :- In a red zone city, 1500 people have been found to be infected by COVID-19 in a month. A random sample of 25 localities or areas in that city have been found to get an average of 30 infected people in a month. Test the hypothesis that the average COVID-19 infected people per area is more than 25. The standard deviation for all areas is 40.
Solution:-
Step 1 :- Define Null & Alternate Hypothesis.
- Null Hypothesis (H0) : population proportion is equal to hypothesized proportion
- Alternate Hypothesis (H1) : population proportion is not equal to hypothesized proportion
Step 2:- Significance level = 0.05.
Step 3 :-Calculate the z test statistic.
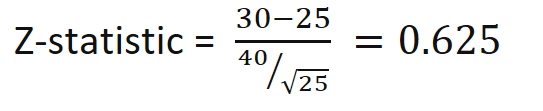
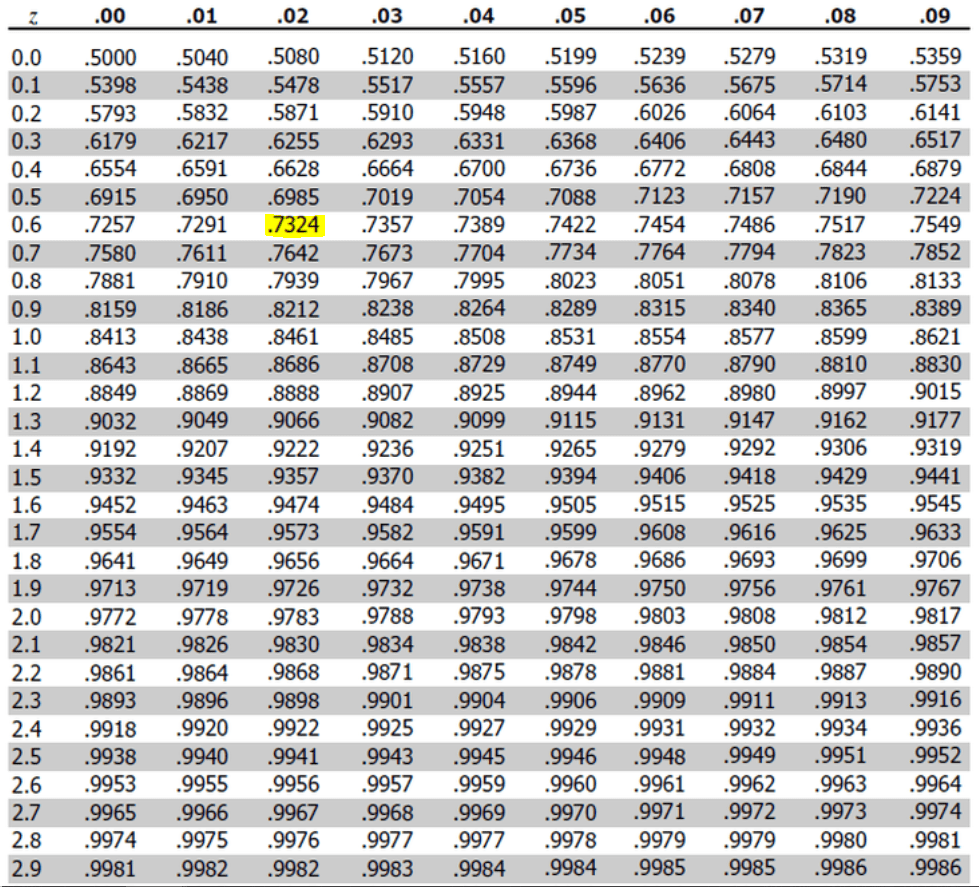
Step 4:– Find the critical value of z in a z table::
Let’s refer the table below to find the right value of Z –

So, p -value=1 – 0.7389 = 0.2611
Tabled value for z = 0.625 is 0.7389
So p -value=1 – 0.7389 = 0.2611
Step 5. Compare the test statistic to the critical z value
P-value (0.2611) > significance level (0.05)
So, the conditional probability that a sample from infected areas with an average COVID-19 infected people per area is more than 25 is p = 0.2611. Should the null hypothesis of a average COVID-19 infected people per area is more than 25 for the city should be rejected? That depends on how conservative you want to be. If you had decided beforehand on a significance level of p < 0.05, the null hypothesis could not be rejected.
Two sample Z- Test:-
It is used to check whether two proportion means are different when the variances are known .
So in simple words, It allows you to compare two proportions to see if they are the same.
- The Null hypothesis (H0) : Proportions are the same.
- The Alternate hypothesis (H1) : Proportions are not the same.
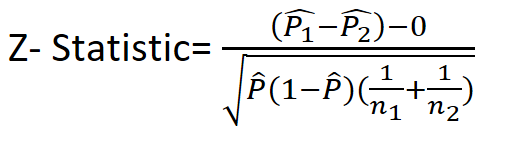
Formula for two proportions Z – test can be written as –
Let us understand Two sample Z- test using an example-
Question:- Let’s say doctors are trying different drug combinations to cure CVODI-19 patients. Let’s say doctors have tried an antiprotozoal medicine called Ivermectin in a single dose with Doxycycline , let’s call this combination Drug A . Another combination that doctors have tried was triple drug combination therapy that included interferon beta-1b, lopinavir–ritonavir and ribavirin and let’s call this combination Drug B. Let’s assume, Drug A works on 28 people out of a sample of 40. Drug B works on 21 people in a sample of 36. Are the two drugs comparable or are they both yield same results ? Use a 5% alpha level.
Answer : Since we’ve two proportions that implies we should perform 2 sample Z- Test for proportions and it’s also an upper one sided test. That’s because we’re asking the question of interest is whether or not p1>p2 and we can denote this like below
Step 1 :- Define Null & Alternate Hypothesis.
- Null Hypothesis (H0) : two proportions are same. i.e. P1-p2=0
- Alternate Hypothesis (H1) : two proportions are not same. i.e. P1-p2>0
Step 2:- Significance level = 0.05.
Step 3 :-Calculate the z test statistic.
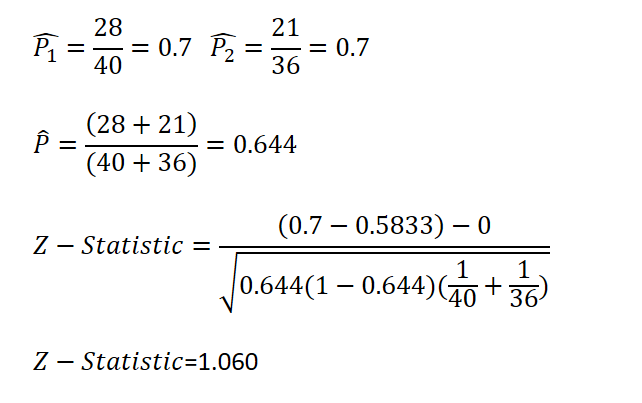
Step 4 :-Find the critical value of z in a z table::
Since we’re doing an upper one-sided test , so now we’ve to find the value that’s greater than 1.060.

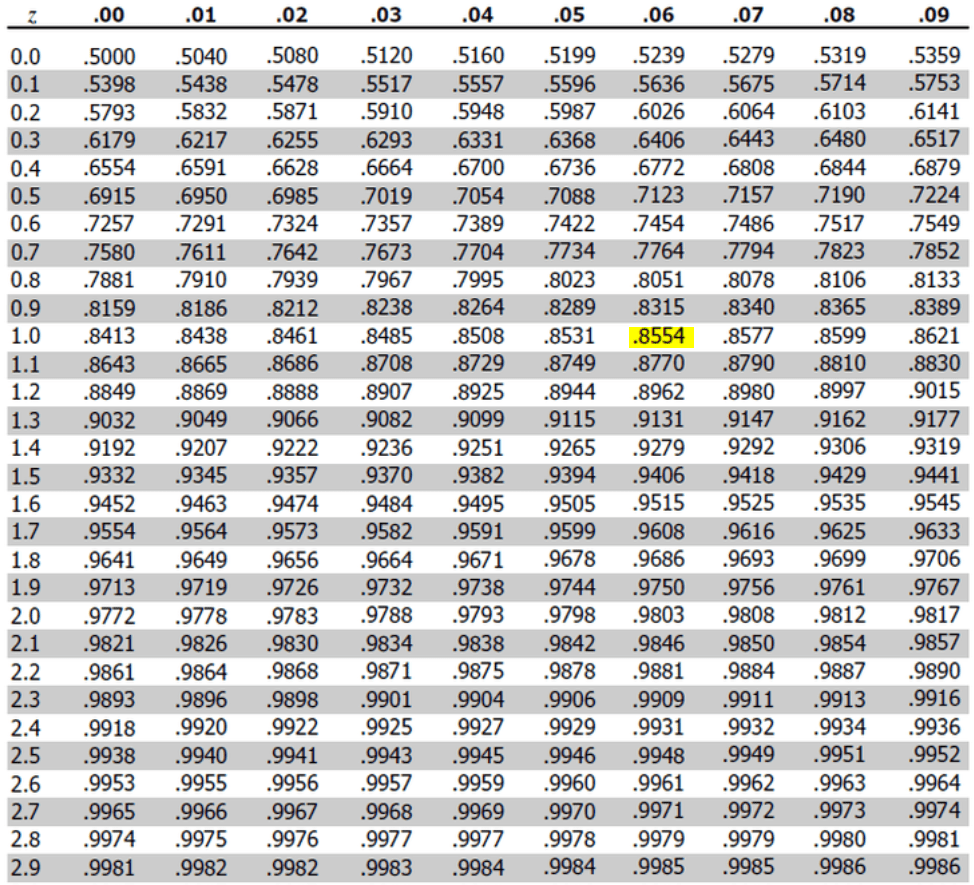
Tabled value for Z is 0.85543 .
So our one sided p-value would be
p-value = 1-0.85543=0.14457
p-value = 0.14457
Step 5. Compare the test statistic to the critical z value.
p-value > significance value alpha i.e.0.05
So we fail to reject our Null Hypothesis.
End Points:-
I’ve tried my bit to explain Z-test as simple as possible. Please feel free to comment down your queries. I’ll be more than happy to answer.
Article Credit:-
Name: Praveen Kumar Anwla
Founder – Towards Machine Learning


