
Introduction:-
one must credit an hypothesis with all that has had to be discovered in order to demolish it –
Jean Rostand
In case of classification problems where we’ve categorical independent variables ,a common thing that one wants to check in before employing any Machine learning algorithm is to check whether there’s any relationship between Independent variable and Dependent variable or are they independent of each other. In simple words whether our independent variables are relevant to the outcome that we want to predict.
If they’re independent of each other, then that input variable is a feature that may be irrelevant to the problem and could be removed from the dataset. This is mostly handled in feature selection phase .
That’s where the Chi- Square test comes in picture , which can be leveraged to check independence between categorical variables. Want some more real time example?
Real time example :-
Let’s say you open a retail store and you predict certain number of footfall (the number of people visiting the retails tore) for 7 days a week. At the end of the week you observe that expected footfall was different from the actual footfall.
So how can you assess the statistical difference between the actual and expected footfall values?

Remember we’ve one categorical variables called ‘Days of week’ with 7 categories i.e. Monday to Sunday ,which could influence footfall of a day. That’s where Chi- square test comes in picture.
The chi-square test helps us answer the above question by comparing the observed frequencies to the frequencies that we might expect to obtain purely by chance.
So let’s dive into the article to understand all about the chi-square test and its different types. The icing on the cake? We will understand each type of Chi Square-test with one example . Let’s get going!
What is Chi- Square Test:-
The Chi-Squared test is a statistical hypothesis test that assumes (the null hypothesis) that the observed frequencies for a categorical variable match the expected frequencies for the categorical variable . In simple words , It tells about the deviation between observed and expected values.
It is named for the Greek capital letter Chi (X) pronounced “ki” as in kite.
Chi- Square statistic formula can be written as –
\displaystyle {{\chi }^{2}} – Chi-Square value
df – Degree of freedom
\displaystyle {{O}_{i}} – Observed Frequency
\displaystyle {{O}_{i}} – Expected Frequency
Or, Chi-square formula can be written as below-
Types of Chi-Square Test:-
There are two types of chi-square tests . Both use the chi-square statistic and distribution of data points for different purposes:
1. Chi-square test for independence:- As the name suggests, This Chi-Square Test is most commonly used to evaluate Tests of Independence .
In simple words It’s commonly used for testing relationships between categorical variables. The null hypothesis of the Chi-Square test is that both the categorical variables are independent ; meaning there’s no relationship between these two categorical variables in the population.
- A very large chi square test statistic suggests that there is a high correlation(association/dependence) between two variables.
- A very small chi square test statistic suggests that there isn’t a relationship(association/dependence).
- Chi square test statistic χ2=0 suggests that your observed and expected values were equal, an event that is unlikely to happen.
2. A chi-square goodness of fit test or Goodness of Fit Test :- It determines if a sample data matches a population. For more details on this type, see: Goodness of Fit Test.
Assumptions of the Chi-Square Test
Just like any other statistical test, the chi-square test comes with a few assumptions of its own:
- Data should be randomly picked from the population
- The categories should be mutually exclusive.
- The data should be in the form of frequencies or counts of a particular category and not in percentages or ratios.
- The data should not consist of paired samples or groups or we can say the observations should be independent of each other
- When more than 20% of the expected frequencies have a value of less than 5 then Chi-square cannot be used. To tackle this problem: Either one should combine the categories only if it is relevant or obtain more data
1. Chi-square test for independence:-
Let’s understand this test using an example.
Question:- Researchers wanted to investigate if the Age and recovery from COVID-19 virus infection has any relation. So they conducted a survey and organized data in the following table-
| Age_Group\Stage | Stage1 | Stage2 | Stage3 | Stage4 |
| Young | 47 | 27 | 33 | 56 |
| Old | 39 | 46 | 42 | 25 |
Solution:- We can solve the above problem using below steps-
Step 1: State Null & Alternate Hypothesis.
- Null Hypothesis (H0):- Age group and recovery are independent ; means they’ve no correlation.
- Alternate Hypothesis (H1):- Age group and recovery are not independent ; means they have correlation.
Step 2: Calculate the degree of freedom
df = ( number of rows-1)( number of columns-1)
=(2-1)(4-1)=3
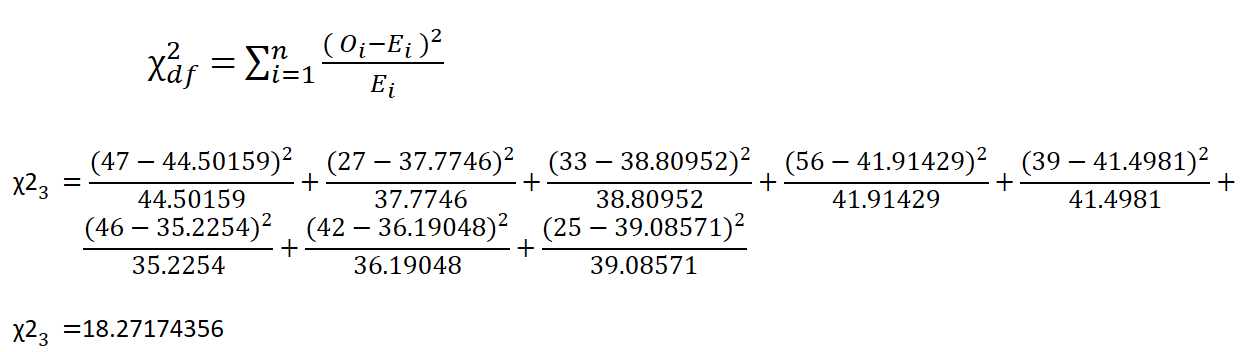
Step 3: Calculate the Chi Square Test statistic.
- Compute Row total , Column Total and overall Row Total.
| Age_Group\Stage | Stage1 | Stage2 | Stage3 | Stage4 | Row Total | |
| Young | 47 | 27 | 33 | 56 | 163 | |
| Old | 39 | 46 | 42 | 25 | 152 | |
| Column Total | 86 | 73 | 75 | 81 | 315 | Overall Row Total |
Make an expected value table from the totals:-
| Age_Group\Stage | Stage1 | Stage2 | Stage3 | Stage4 | Row Total | |
| Young | 44.50159 | 37.7746 | 38.80952 | 41.914291 | 163 | |
| Old | 41.49841 | 35.2254 | 36.19048 | 39.08571 | 152 | |
| Column Total | 86 | 73 | 75 | 81 | 315 | Overall Row Total |
Calculate the Chi-Square Statistic value-
Step 4 : Find Chi- Square critical value at df=3 & significance level α=0.05 using Chi- Square table and compare that with your Chi- Square test statistic value.
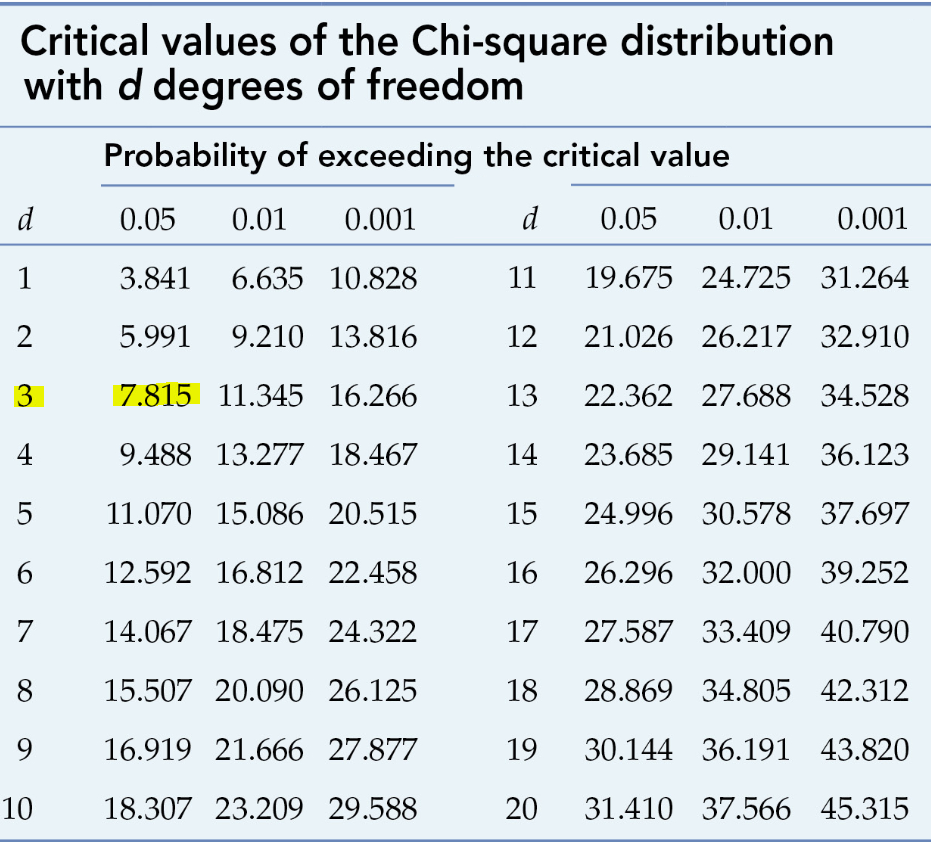
From the table above, we see that Chi – Square critical value= 7.815 , which is smaller than our Chi- Square statistic value i.e. 18.271.
Step 5:- Interpretation of results
Since Chi- Square statistic > Critical value
Our Chi- Square statistic (18.271) > Chi – Square critical value(7.815)
Hence we can reject the Null Hypothesis H0 ; that is there’s no relation between Age group and recovery of the person.
2. Chi-square goodness of fit test :-
Let’s understand this test using an example below-
Question:- All COVID-19 patients have been admitted to different isolation wards. Now government decided to conduct a survey to assess patients satisfaction with meal served in hospital. The survey revealed that ,55% of all patients reported to be not happy with food services , 25% reported to be happy with meal served in hospital & 20% reported to be neutral in their satisfaction of food served in hospital. So hospital decided to launch a “Better Nutrition program” with aim to cater their patients in best possible manner. Under this campaign , survey has been conducted to ask people food of their choice or food that they would like to be included in their meal.
The next month , To evaluate the impact of the program, the Hospital again surveyed patients and asked the same questions. The survey was completed by 681 patients and the following data were collected on the food services question:
| Satisfaction level | Not happy | Happy | Neutral |
| Number of patients | 325 | 190 | 120 |
Solution:-
Step 1: State the Null & Alternate Hypothesis-
- H0 (Null Hypothesis)- No change or no difference in situation. If the Better Nutrition program has no impact then we expect the distribution of responses to the food services question to be the same as that measured prior to the implementation of the program.
- H1 (Alternate Hypothesis)- Change in situation.
Step 2 . Compute degree of freedom
df = (categories-1)
df=3-1=2
Step 3 . Calculate the Chi Square Test statistic.
| Satisfaction level | Not happy | Happy | Neutral | Total |
| Number of patients | 325 | 190 | 120 | 635 |
Make an expected value table from the totals:-
For each entry do the following-
(Row total* Column Total ) /Overall Total
| Not happy | Happy | Neutral | Total | |
| Observed Frequencies (O) | 325 | 190 | 120 | 635 |
| Expected Frequencies (E) | 635*0.55 =349.25 | 635*0.25 =158.75 | 635*0.20 =127 | 635 |
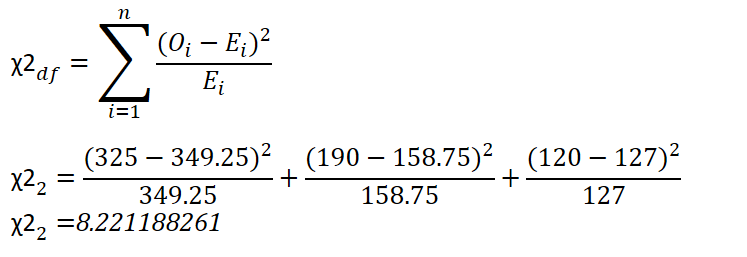
Calculate the Chi-Square Statistic value-
Step 4 : Find Chi- Square critical value at df =2 & significance level α=0.05 using Chi- Square table and compare that with your Chi- Square test statistic value.
From the table above, we see that Chi – Square critical value= 7.815 , which is smaller than our Chi- Square statistic value i.e. 8.221.
Step 5:- Interpretation of results
Since Chi- Square statistic > Critical value
Our Chi- Square statistic (8.221) > Chi – Square critical value(7.815)
Hence we can reject the Null Hypothesis (H0 ); that means we can conclude that the distribution of responses to the food service questions following the implementation of the ‘Better Nutrition program’ campaign was not the same as the distribution prior.
End Notes:-
I’ve tried my bit to explain Chi-Square test as simple as possible. Please feel free to comment down your queries. I’ll be more than happy to answer.
You can follow my this same article on renowned Data Science blog at https://medium.com/@praveenkumar.kumar76/chi-square-test-covid-19-a549eddade34
Article Credit:-
Name: Praveen Kumar Anwla Founder – TowardsMachineLearning.Org


